No. GMI is not the same as A1C. GMI (Glucose Management Indicator) is an estimate derived from continuous glucose monitor (CGM) data, while A1C is a laboratory measurement of glucose bound to hemoglobin in your red blood cells. The two numbers usually land within 0.3-0.5% of each other, but meaningful gaps are common and each number tells you something slightly different about your glucose control.
What A1C Actually Measures
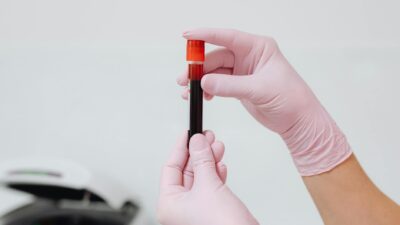
A1C (hemoglobin A1c, HbA1c) measures the percentage of hemoglobin molecules in your red blood cells that have glucose chemically attached. Because red blood cells live about 120 days, A1C reflects the average glucose exposure over the prior 2 to 3 months. Lab A1C is performed on a blood sample using high-performance liquid chromatography or immunoassay and reports directly in percent. Learn more in our A1C levels guide.
What GMI Measures
GMI is calculated from the mean glucose reported by a CGM over at least 12-14 days. The formula was developed by Bergenstal and colleagues in 2018:
GMI (%) = 3.31 + (0.02392 x mean glucose in mg/dL)
Or in mmol/L: GMI (%) = 3.31 + (0.4317 x mean glucose in mmol/L)
GMI is reported by most CGM platforms (Dexcom Clarity, FreeStyle Libre LibreView, Stelo) in the Ambulatory Glucose Profile summary. It replaced the earlier term “estimated A1C (eA1C)” to avoid confusion between the estimate and a true lab measurement.
GMI vs. A1C – The Key Differences
| Feature | A1C | GMI |
|---|---|---|
| What it measures | Glucose bound to hemoglobin | Mean glucose from CGM, converted |
| Time window | Last 2-3 months (weighted to recent) | Last 14 days (typical) |
| Method | Blood sample, laboratory test | Calculated from CGM data |
| Affected by red blood cell lifespan | Yes – major factor | No |
| Affected by anemia or hemoglobin variants | Yes – can be biased | No |
| Use for diagnosis | Yes – ADA-recommended | No |
| Use for short-term tracking | Less responsive | Highly responsive |
| Availability | Clinic lab draw | Built into CGM apps |
Why the Two Numbers Can Disagree
A 2019 study of CGM users found that GMI differed from lab A1C by more than 0.5% in roughly 50% of participants and by more than 1% in about 25%. The most common reasons for gaps:
- Red blood cell lifespan: people with longer-lived red blood cells accumulate more glucose-hemoglobin binding, producing a higher A1C than GMI predicts. Shorter lifespan produces the opposite.
- Hemoglobin variants: sickle cell trait, thalassemia, and HbS or HbC can interfere with A1C measurement.
- Iron-deficiency anemia: can raise A1C without a change in glucose.
- Pregnancy: changes red blood cell turnover and shifts the relationship.
- Chronic kidney disease: alters red blood cell lifespan.
- Recent blood transfusion or blood loss: temporarily changes A1C.
- Short CGM wear time: fewer than 14 days or less than 70% coverage produces unreliable GMI.
Example: How to Interpret a Gap
Scenario A: Your lab A1C is 7.2% but your CGM shows a 14-day GMI of 6.4%. Possibilities include anemia raising A1C, or your glucose was much higher 2-3 months ago and has recently improved. Check iron studies and compare your GMI trend over the past 90 days.
Scenario B: Your lab A1C is 5.8% but your GMI is 6.8%. This may indicate a shorter red blood cell lifespan, or your CGM is reading slightly higher than lab glucose. Cross-check CGM readings with a few fingersticks.
Which One Should You Rely On?
Use both. They answer different questions.
- Use A1C for: diagnosis, medication decisions, insurance documentation, long-term trend over years, and comparison with published outcome studies.
- Use GMI for: tracking short-term response to diet, medication, or exercise changes, detecting hyperglycemia or hypoglycemia patterns, and adjusting behavior between clinic visits.
The 2019 International Consensus on Time in Range recommends pairing GMI with other CGM metrics – time in range (70-180 mg/dL), time below range, and glucose variability – for a fuller picture than any single number.
Time in Range vs. A1C
Time in Range (TIR), defined as the percent of time spent between 70 and 180 mg/dL, has become a complementary metric to both GMI and A1C. For each 10% increase in TIR, A1C drops by about 0.5%. Two people with the same A1C of 7.0% can have very different TIR – one with steady glucose and another with frequent highs and lows – and their long-term complication risks may differ.
Practical Steps
- Check GMI in your CGM app every 2 weeks to spot trends early
- Get lab A1C every 3-6 months as recommended by your provider
- Note any persistent gap of 1% or more and share with your doctor
- Track TIR alongside GMI – aim for more than 70% time in range
- Keep lifestyle steady during the weeks before your lab draw to avoid misleading changes
For a deeper look at how A1C fits into the bigger picture of prediabetes, see our hub and related guides.
The Bottom Line
GMI is not the same as A1C. GMI is a short-term, CGM-derived estimate unaffected by red blood cell quirks, while A1C is a long-term, laboratory-measured value that remains the clinical standard for diagnosis. Use GMI to steer day-to-day decisions and A1C to confirm your progress. When they disagree by more than 0.5%, dig into why – the answer often reveals something useful about your physiology or your data.