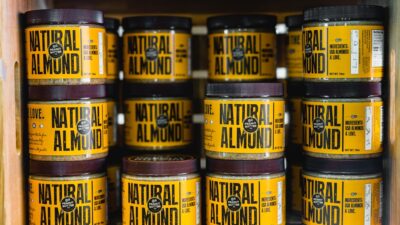
Do beans raise blood sugar? Yes — but modestly, slowly, and in a way that supports long-term metabolic health. Most beans contain 20 to 30 grams of net carbs per 1 cup cooked serving, which is enough to produce a measurable glucose rise of 20 to 50 mg/dL in most people. What sets beans apart from other carb-containing foods is the curve — low glycemic index (22 to 39), high resistant starch, and abundant fiber produce a slow, flat, drawn-out glucose rise that often peaks at 90 to 180 minutes rather than the typical 60 minute peak from rice or bread. Despite the glucose rise, regular bean consumption is one of the most evidence-supported dietary patterns for lowering A1c and reducing diabetes risk.
How Much Beans Raise Blood Sugar
| Bean | Serving | Net Carbs (g) | GI | Typical Peak Rise | Time to Peak |
|---|---|---|---|---|---|
| Lentils | 1 cup | 24 | 28-29 | 20-40 mg/dL | 90-180 min |
| Kidney beans | 1 cup | 27 | 24-29 | 25-45 mg/dL | 90-180 min |
| Black beans | 1 cup | 25 | 30 | 25-45 mg/dL | 90-180 min |
| Pinto beans | 1 cup | 30 | 33-39 | 30-50 mg/dL | 90-180 min |
| Chickpeas | 1 cup | 32 | 28-36 | 30-50 mg/dL | 90-180 min |
| Soybeans | 1 cup | 7 | 15-20 | 5-15 mg/dL | 60-90 min |
| Edamame | 1 cup | 6 | 15-20 | 5-15 mg/dL | 60-90 min |
| Baked beans, canned (sweet) | 1 cup | 44 | 40-48 | 50-90 mg/dL | 60-120 min |
| Refried beans, canned | 1 cup | 31 | 38-44 | 35-65 mg/dL | 60-120 min |
Why the Curve Is Slow and Flat
Three features of beans combine to spread the glucose rise over a longer window:
- Resistant starch: 30 to 40 percent of bean starch is not digested in the small intestine — it ferments in the colon, bypassing the blood glucose curve entirely.
- Soluble fiber: 5 to 8 grams per cup forms a gel in the gut that slows the speed of digestion and absorption.
- Protein content: 15 to 18 grams per cup slows gastric emptying and triggers satiety hormones that delay further absorption.
The practical result: an apple and a cup of black beans have roughly the same carb count, but the apple peaks at 45 minutes with a sharp curve, while the beans peak at 2+ hours with a flatter, lower curve.
Beans vs Other Carbs: A Direct Comparison
| Food (equal carb amount: ~30 g) | GI | Typical Peak | Curve Shape |
|---|---|---|---|
| White bread (2 slices) | 75 | 60-90 mg/dL | Sharp peak, fast return |
| White rice (3/4 cup cooked) | 73 | 50-80 mg/dL | Sharp peak |
| Brown rice (3/4 cup cooked) | 50-68 | 40-70 mg/dL | Moderate peak |
| Whole wheat pasta (3/4 cup al dente) | 45-50 | 30-55 mg/dL | Moderate, slower |
| Black beans (1 cup) | 30 | 25-45 mg/dL | Flat, delayed peak |
| Lentils (1 cup) | 28 | 20-40 mg/dL | Flat, delayed peak |
The Delayed Peak: A Common Source of Confusion
Beans produce a glucose curve that often peaks at 90 to 180 minutes after eating, later than most carb foods. This pattern can be confusing if you only test once after a meal:
- At 60 minutes after a bean meal, glucose may be only modestly elevated — the bean carbs are still digesting.
- At 90 to 120 minutes, glucose may be at its actual peak.
- At 180 minutes, glucose typically returns toward baseline.
- If you test only at 1 hour and only at 2 hours, you may either miss the peak entirely or catch it on the way down.
- A continuous glucose monitor reveals the full curve and is the most accurate way to assess bean response.
Plain Beans vs Sweetened Bean Products
Not all beans are equivalent. Canned bean products with added sugar behave very differently from plain beans:
| Product | Added Sugar per Cup | Effect on Blood Sugar |
|---|---|---|
| Plain canned black, kidney, pinto, navy | 0 g | Slow, modest rise |
| Canned baked beans (Bush’s original) | 12-15 g | Faster, larger rise |
| Boston-style baked beans | 15-20 g | Significant rise |
| Canned chili beans in sauce | 4-8 g | Moderate rise |
| Refried beans (regular) | 0-2 g (but added lard/oil) | Faster rise than whole beans |
| Vegetarian refried beans | 0-2 g | Closer to plain beans |
Pairings That Lower the Bean Rise Further
- Olive oil and avocado: 1 to 2 tablespoons of olive oil or 1/4 avocado further slows digestion.
- Vinegar or lemon juice: a tablespoon in dressing lowers post-meal glucose 15 to 25 percent.
- Animal protein: chicken, fish, or eggs further flattens the curve.
- Non-starchy vegetables: peppers, onions, leafy greens, mushrooms.
- Herbs and spices: cumin, turmeric, garlic, oregano — flavor with no glucose impact.
- 10 to 20 minute walk after the meal: typically lowers peak by 20 to 30 percent.
Pairings That Raise the Rise
- Beans + white rice: doubles the carb load; rice peaks earlier and beans peak later, creating a sustained glucose elevation.
- Beans + corn tortillas: adds 30 to 40 g of carbs from the tortillas.
- Bean burrito with rice, cheese, sour cream: can easily exceed 80 g of carbs in one meal.
- Baked beans + cornbread: two starchy carbs together.
- Bean dip + tortilla chips: the chips are the main carb source.
The Long-Term Picture
Despite the modest glucose rise from individual bean meals, regular bean consumption consistently improves long-term metabolic markers:
- A 2009 meta-analysis in Diabetologia found 3 or more servings of legumes per week lowered A1c by 0.3 to 0.5 percentage points.
- Bean consumption is linked to 5 to 10 mg/dL lower LDL cholesterol.
- Modest blood pressure reduction of 2 to 4 mmHg with regular intake.
- Higher satiety per calorie supports weight loss, which improves insulin sensitivity.
- Fermentation of resistant starch in the colon produces butyrate, which has been linked to better insulin sensitivity.
Practical Diabetes-Friendly Strategies
- Eat 4 to 7 bean servings per week: consistency matters more than a single meal.
- Keep portion to 1/2 to 1 cup cooked: the sweet spot for most people with diabetes.
- Choose plain beans: home-cooked dried or canned drained-and-rinsed.
- Skip the daily baked beans: added sugar pushes the GI and GL up substantially.
- Pair with vegetables and a fat source: the Mediterranean approach.
- Avoid bean + rice + bread combos: pick one starch.
- Walk after meals: 10 to 20 minutes lowers peak glucose 20 to 30 percent.
- Use a CGM or test at 90 and 180 minutes: the delayed peak is often missed with standard 1-hour testing.
Personal Response Testing
- Test 1 cup of black beans alone at 30, 60, 90, 120, and 180 minutes — the full curve reveals the actual peak.
- Compare home-cooked dried vs canned drained-and-rinsed for the same variety.
- Compare beans alone vs beans + rice — the difference can be 30 to 50 mg/dL on the peak.
- Test with and without 1 tablespoon olive oil and 1 tablespoon vinegar added — typical reduction is 15 to 25 percent.
- Avoid generalizing from one bad reading — bean response varies day-to-day with sleep, stress, and time of day.
Related Reading
See our broader guides on diet-and-nutrition, beans glycemic index, and why do beans spike my blood sugar.
For external authoritative reading, the American Diabetes Association recommends legumes as a core carbohydrate source, and the CDC diabetes resources describe beans as a high-fiber, blood-sugar-friendly carbohydrate when portioned appropriately.
The Bottom Line
Beans do raise blood sugar — but in a slow, modest, and metabolically friendly way. A 1/2 to 1 cup serving typically produces a 20 to 50 mg/dL rise that peaks at 90 to 180 minutes rather than the sharp 60 minute peak from rice or bread. The low glycemic index (22 to 39), high resistant starch content, soluble fiber, and plant protein all combine to flatten the curve. Despite the glucose rise from individual meals, regular bean consumption (3+ servings per week) consistently lowers A1c, improves cholesterol, and supports weight management. Keep portions modest, choose plain over sweetened varieties, pair with vegetables and a fat source, and beans become one of the best carbohydrate foods you can choose for diabetes and prediabetes.