A fasting blood sugar levels chart breaks morning glucose into three clear categories: below 100 mg/dL is normal, 100 to 125 mg/dL indicates prediabetes, and 126 mg/dL or higher on two separate tests meets the American Diabetes Association criterion for type 2 diabetes. Fasting is defined as no food or caloric drinks for at least eight hours.
The Fasting Blood Sugar Levels Chart
| Fasting Value (mg/dL) | Fasting Value (mmol/L) | Category | What It Suggests |
|---|---|---|---|
| Below 70 | Below 3.9 | Hypoglycemia | Low blood sugar – needs evaluation if not on medication |
| 70-89 | 3.9-4.9 | Optimal | Healthy metabolic range |
| 90-99 | 5.0-5.5 | Normal (upper) | Still normal; consider lifestyle if trending up |
| 100-109 | 5.6-6.0 | Early prediabetes | Good time to act; often reversible |
| 110-125 | 6.1-6.9 | Higher-risk prediabetes | Structured lifestyle program and A1C recommended |
| 126-180 | 7.0-10.0 | Diabetes (early) | Confirm with second test; discuss treatment plan |
| Above 180 | Above 10.0 | Diabetes (uncontrolled) | Prompt medical follow-up |
What “Fasting” Really Means
Fasting blood sugar measures glucose in a steady-state condition — no food, no sweetened beverages, and usually no more than a small amount of water for eight hours. Black coffee and tea are often tolerated but may slightly raise cortisol. Most labs and home tests recommend drawing first thing in the morning before any medication is taken, unless your prescriber has told you otherwise.
Alcohol the night before can lower fasting glucose artificially. A late, high-carb dinner can raise it. For reproducible numbers, try to keep the prior evening consistent when you test.
Why Fasting Glucose Matters
Fasting glucose reflects how well your liver and pancreas keep blood sugar stable in the absence of food. When insulin resistance develops, the liver releases more glucose overnight and the pancreas cannot fully offset it, pushing morning values up. That makes fasting glucose one of the earliest measurable signs of prediabetes.
Along with A1C and an oral glucose tolerance test, fasting plasma glucose is one of the three diagnostic tools accepted by the ADA and the CDC.
How Fasting Glucose Compares to A1C
Fasting glucose is a snapshot; A1C is a two-to-three-month average. They usually agree, but not always. Some people have high fasting values but normal post-meal numbers, while others have the opposite pattern. Having both tests paints a fuller picture. See the A1C levels guide for how the two numbers line up at each stage.
Confirming an Abnormal Result
One elevated fasting reading is not a diagnosis. The ADA recommends confirming a result of 126 mg/dL or higher with one of the following:
- A repeat fasting plasma glucose at 126 mg/dL or higher on a separate day
- An A1C of 6.5% or higher
- A two-hour oral glucose tolerance test value of 200 mg/dL or higher
- A random glucose of 200 mg/dL or higher with classic symptoms (thirst, frequent urination, unexplained weight loss)
Why Fasting Glucose Can Vary From Day to Day
Even people with excellent control see a 10 to 20 mg/dL swing between mornings. Common drivers include:
- Dawn phenomenon: Cortisol, growth hormone, and glucagon rise before waking.
- Poor sleep: Even one short night can raise insulin resistance.
- Stress: Adrenaline and cortisol increase liver glucose output.
- Illness or infection: Inflammation raises counterregulatory hormones.
- Medications: Steroids, beta blockers, thiazide diuretics, some antidepressants, and certain antipsychotics.
- Late, heavy, or alcohol-containing dinners
- Dehydration: Concentrates glucose.
What You Can Do If Your Fasting Sugar Is High
The good news is that fasting glucose responds to lifestyle change, sometimes within weeks.
- Aim for 150 minutes of moderate activity weekly, including resistance training twice a week.
- Lose 5 to 7% of body weight if overweight — the target from the Diabetes Prevention Program.
- Shift toward fiber-rich, minimally processed foods. The diet and nutrition section has meal-planning details.
- Stop eating three hours before bedtime to lower overnight liver glucose release.
- Protect sleep quality and manage chronic stress.
- Ask your clinician whether metformin or a short trial of continuous glucose monitoring is appropriate.
Special Populations
Pregnancy
Pregnant women are screened with glucose tolerance testing rather than fasting alone. Gestational diabetes targets are tighter (fasting below 95 mg/dL) and are managed by an obstetric team.
Older Adults
Looser targets (fasting up to 130 to 150 mg/dL) may be acceptable in frail older adults to reduce the risk of hypoglycemia-related falls.
Athletes and Low-Carb Dieters
People on ketogenic diets sometimes show transiently higher fasting numbers due to “physiological insulin resistance.” A1C and post-meal readings usually remain normal. Discuss the full pattern with your doctor before labeling it prediabetes.
When to Get Tested
The ADA and CDC recommend routine screening for adults at age 35, earlier if you have risk factors (overweight, family history of diabetes, polycystic ovary syndrome, gestational diabetes history, certain ethnic backgrounds). Repeat testing every three years is reasonable if your result is normal and every six to twelve months if you are in the prediabetes range.
Home Testing vs. Lab Testing
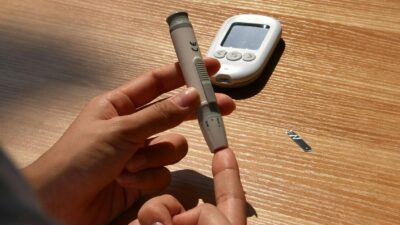
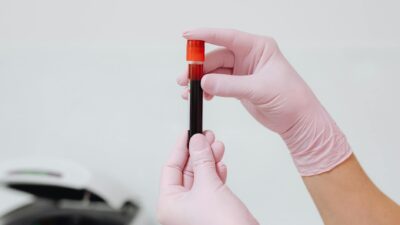
Home meters are useful for tracking trends but are not usually used to make a formal diagnosis. A certified laboratory plasma glucose result is the standard. If you are using a home meter, note that capillary (fingerstick) glucose tends to read slightly different from venous plasma values. Use your home trend as a conversation starter with your clinician rather than a verdict.
The Bottom Line
A fasting blood sugar levels chart turns one morning number into useful context. Below 100 mg/dL is normal, 100 to 125 mg/dL signals prediabetes, and 126 mg/dL or higher on two occasions meets the diabetes threshold. Single readings fluctuate, so look for patterns across two weeks, confirm abnormal values with repeat or A1C testing, and focus on the lifestyle basics that have the strongest evidence — weight, activity, sleep, and a fiber-rich eating pattern.