The C in A1C is a biochemistry label, not an abbreviation for any word. The full test name is hemoglobin A1c (HbA1c), where “Hb” means hemoglobin, “A” means adult hemoglobin, and “1c” identifies one specific subfraction of the molecule separated during lab analysis. The A1c fraction is the form of hemoglobin that binds glucose, which is why it works as a measure of average blood sugar.
The Full Name: Hemoglobin A1c
Hemoglobin is the oxygen-carrying protein packed inside red blood cells. In healthy adults, about 97 percent of hemoglobin is the A form (adult), about 2.5 percent is A2, and a trace amount is F (fetal). When researchers ran adult hemoglobin through chromatography in the 1960s, they found it separated into several peaks they labeled A1a, A1b, and A1c. The A1c peak, which makes up 4-6 percent of total hemoglobin in non-diabetics, was later shown to be hemoglobin with glucose covalently attached to the beta chain’s valine residue.
How the Discovery Happened
In 1969, Samuel Rahbar at Tehran University’s biochemistry department published the first observation that patients with diabetes had an unusually high level of the A1c fraction. He did not know exactly why, but subsequent work through the 1970s showed that glucose in the bloodstream slowly and irreversibly attaches to hemoglobin in a process called glycation. The higher the blood sugar, the more glycation, and the more A1c. By the early 1980s, A1c had become a standard clinical test. The ADA first recommended it for diabetes diagnosis in 2010.
Why the Test Works
Red blood cells live about 120 days. During that time, glucose molecules in the plasma bind continuously to hemoglobin in a non-enzymatic reaction. The binding is irreversible, so once a hemoglobin molecule is glycated, it stays that way until the red blood cell is recycled. At any moment, the pool of red blood cells in your body contains cells of every age from brand-new to nearly 120 days old. The average glycation level across that pool reflects your average blood glucose over the past two to three months, with the most recent month weighted more heavily.
What the Number Means
| A1C (%) | Average glucose (mg/dL) | Category |
|---|---|---|
| Below 5.7 | Below 117 | Normal |
| 5.7-6.4 | 117-137 | Prediabetes |
| 6.5-6.9 | 140-154 | Early diabetes |
| 7.0-7.9 | 154-183 | Diabetes, typical treatment range |
| 8.0 or higher | Above 183 | Elevated diabetes |
The ADA diabetes thresholds come from the 2024 Standards of Care in Diabetes. For a detailed walk-through of A1C interpretation at each level, see the A1C levels hub.
How the Lab Measures It
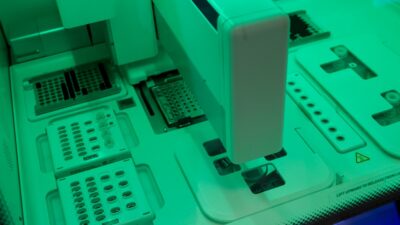
Modern lab assays use one of three methods. High-performance liquid chromatography (HPLC) separates hemoglobin fractions by charge, measuring A1c directly. Immunoassays use an antibody that binds the glycated N-terminus. Enzymatic methods cleave the glycated valine and quantify it. All three are standardized against the DCCT (Diabetes Control and Complications Trial) reference, which is why A1C values are comparable across labs worldwide. Point-of-care fingerstick A1C devices used in clinics produce results within five minutes.
Why A1C Is the Preferred Test
A1C does not require fasting, is stable over hours and days, and reflects two to three months of glucose exposure rather than a single moment. That makes it harder to game with short-term dietary changes, more reproducible across visits, and easier for busy patients to fit into a clinic visit. Random glucose varies by the hour; fasting glucose varies day to day; A1C changes slowly and meaningfully. For a broader overview, see the prediabetes 101 hub.
When A1C Does Not Tell the Whole Story
Anything that shortens red blood cell life makes A1C falsely low (hemolysis, recent blood loss, hemolytic anemia, G6PD deficiency, pregnancy). Anything that lengthens it makes A1C falsely high (iron deficiency anemia, splenectomy, chronic kidney disease with erythropoietin deficiency). Hemoglobin variants like HbS (sickle cell trait), HbC, and HbE can interfere with certain assay methods. If A1C does not match your home glucose readings or your clinical picture, your doctor may order a fructosamine test or use a continuous glucose monitor to cross-check.
Converting A1C to Average Glucose
The 2008 Nathan equation from the ADAG study lets you convert A1C to estimated average glucose: eAG (mg/dL) = 28.7 x A1C – 46.7. An A1C of 5.7 percent corresponds to an average of 117 mg/dL; 6.5 percent equals 140 mg/dL; 7.0 percent equals 154 mg/dL. This formula is embedded in most CGM apps and lab reports.
The Bottom Line
The C in A1C is a biochemistry labeling convention for a specific hemoglobin subfraction, not an abbreviation for a word. The full name is hemoglobin A1c, the fraction of hemoglobin that has glucose covalently attached. Because red blood cells live about 120 days, the measurement reflects your average blood sugar over roughly three months. It remains the most reliable single number for diagnosing and monitoring diabetes.