The eAG lab test — short for estimated average glucose — is a calculated number that translates your A1C percentage into the same mg/dL units your home glucose meter uses. Instead of reading “A1C 6.0%,” your lab report may also show “eAG 126 mg/dL,” making the result more intuitive. No extra blood draw or fasting is required.
What the eAG Lab Test Measures
eAG is not a separate blood test. It is a mathematical conversion of your A1C result into mg/dL, using a formula validated by the American Diabetes Association:
eAG (mg/dL) = 28.7 × A1C − 46.7
The formula was developed from the 2008 A1C-Derived Average Glucose (ADAG) study, which correlated A1C values with thousands of self-monitored blood glucose readings from patients with and without diabetes.
The goal was simple: A1C is reported as a percentage, but home meters show glucose in mg/dL. Many patients found the two units hard to compare. eAG bridges that gap.
eAG vs. A1C Conversion Chart
Here is a quick reference showing how A1C translates to eAG across the prediabetes and diabetes ranges.
| A1C (%) | eAG (mg/dL) | Category |
|---|---|---|
| 5.0% | 97 | Normal |
| 5.5% | 111 | Normal |
| 5.7% | 117 | Prediabetes (lower edge) |
| 6.0% | 126 | Prediabetes |
| 6.4% | 137 | Prediabetes (upper edge) |
| 6.5% | 140 | Diabetes |
| 7.0% | 154 | Diabetes |
| 8.0% | 183 | Diabetes — uncontrolled |
| 9.0% | 212 | Diabetes — uncontrolled |
If your A1C is 5.8% and your eAG is 120 mg/dL, that means your average blood sugar over the past 2-3 months has been roughly 120 mg/dL — which places you in the prediabetes range. For more detail on each level, see our A1C levels guide.
How to Prepare for an eAG Lab Test
Because eAG is derived from the A1C test, preparation is the same as A1C:
- No fasting required. Eat, drink, and take medications normally.
- Stay hydrated. Water makes the blood draw easier.
- Mention medical conditions. Anemia, hemoglobin variants, kidney disease, pregnancy, or recent transfusions can affect A1C (and therefore eAG) accuracy.
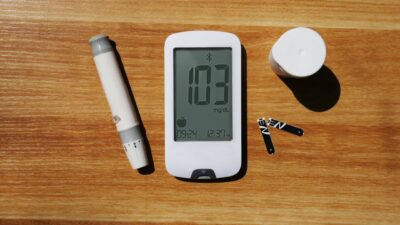
- Keep a timing log. If you also use a home glucose meter, your meter’s 90-day average provides a real-world check against the calculated eAG.
How Accurate Is eAG?
The ADAG study that produced the formula showed a strong correlation between A1C and measured average glucose across most adults. However, eAG is an estimate, and there is individual variability — roughly 95% of people fall within ±15 mg/dL of the calculated number.
Factors that can create mismatches between your home meter average and eAG include:
- Anemia or abnormal red blood cell lifespan
- Hemoglobin variants (sickle cell trait, thalassemia)
- Chronic kidney disease
- Pregnancy
- Recent blood transfusion or significant blood loss
- Large differences between fasting and post-meal readings
If your home meter average and lab eAG differ by more than about 20-30 mg/dL, bring both numbers to your doctor to investigate possible A1C interference.
Using eAG to Track Progress
Many people find eAG easier to use as a goal than A1C. Dropping from an eAG of 140 mg/dL to 117 mg/dL feels more tangible than moving from 6.5% to 5.7%, even though they describe the same biological change.
If your eAG is in the prediabetes range, the encouraging news is that prediabetes can be reversed. Weight loss of 5-7% of body weight, regular physical activity, and dietary adjustments have been shown to reduce A1C and eAG into the normal range within months.
The Bottom Line
The eAG lab test is a conversion of your A1C into mg/dL so you can compare it directly to home glucose meter readings. It doesn’t require a separate draw or fasting — it’s calculated from the A1C result. An eAG under 117 mg/dL is generally in the normal range; 117-137 mg/dL is prediabetes; 140 mg/dL or higher is in the diabetes range. Use eAG alongside your home meter and A1C readings to build a complete picture of your glucose control, and discuss any discrepancies with your doctor.