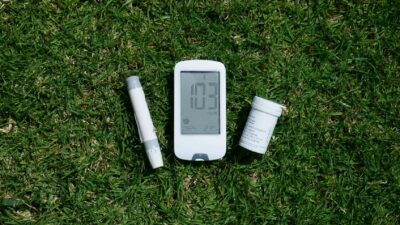
A HOMA-IR calculator multiplies your fasting insulin by your fasting glucose, then divides by a constant (405 in US units, 22.5 in SI units). The result is a single number — under 1.0 is optimal, 1.0 to 2.0 is normal, 2.0 to 2.5 is early insulin resistance, 2.5 to 5.0 is significant, and above 5.0 is severe. The index is the simplest and most widely used way to quantify insulin resistance from a single fasting blood draw.
What HOMA-IR Is
HOMA-IR stands for Homeostasis Model Assessment of Insulin Resistance. It was published in 1985 by David Matthews and colleagues at Oxford as a way to estimate insulin sensitivity and beta-cell function without doing a labor-intensive hyperinsulinemic-euglycemic clamp (the research gold standard). The original paper described both HOMA-IR (the resistance index) and HOMA-β (a beta-cell function index).
The conceptual basis — if your tissues are insulin-resistant, your pancreas must work harder to keep fasting glucose normal, resulting in higher fasting insulin. The product of fasting insulin and fasting glucose, normalized to a constant, captures both the resistance and the compensatory secretion.
The Formulas
| Unit system | Formula | Example values |
|---|---|---|
| US (mg/dL) | HOMA-IR = (insulin × glucose) / 405 | Insulin 12 microIU/mL, glucose 100 mg/dL → 2.96 |
| SI (mmol/L) | HOMA-IR = (insulin × glucose) / 22.5 | Insulin 12 mIU/L, glucose 5.55 mmol/L → 2.96 |
The two formulas give the same number — the divisor 22.5 accounts for the conversion 1 mmol/L glucose = 18 mg/dL (since 22.5 × 18 = 405).
Interpretation Thresholds
| HOMA-IR | Category | Clinical meaning |
|---|---|---|
| Less than 1.0 | Optimal | Excellent insulin sensitivity; very low T2D risk |
| 1.0 to 2.0 | Normal | Healthy insulin sensitivity |
| 2.0 to 2.5 | Early insulin resistance | Lifestyle intervention strongly recommended |
| 2.5 to 5.0 | Significant insulin resistance | Active metabolic dysfunction; high T2D and NAFLD risk |
| Greater than 5.0 | Severe insulin resistance | Common in obesity, PCOS, advanced NAFLD, metabolic syndrome |
| Greater than 10.0 | Extreme | Investigate insulinoma or genetic insulin resistance syndromes |
Cutoffs vary slightly across populations. Some Asian studies use a lower threshold (1.7 to 2.0) for “insulin resistance,” reflecting different body composition at equivalent metabolic risk.
Worked Examples
| Fasting insulin | Fasting glucose | HOMA-IR (US) | Category |
|---|---|---|---|
| 4 microIU/mL | 85 mg/dL | 0.84 | Optimal |
| 8 microIU/mL | 90 mg/dL | 1.78 | Normal |
| 10 microIU/mL | 92 mg/dL | 2.27 | Early IR |
| 14 microIU/mL | 96 mg/dL | 3.32 | Significant IR |
| 20 microIU/mL | 105 mg/dL | 5.19 | Severe IR |
| 30 microIU/mL | 115 mg/dL | 8.52 | Severe IR |
| 45 microIU/mL | 140 mg/dL | 15.56 | Extreme |
HOMA-β (Beta-Cell Function Index)
Matthews’s original paper also defined a beta-cell function index, HOMA-β:
- US formula: HOMA-β = (20 × fasting insulin) / (fasting glucose − 3.5), where glucose is converted to mmol/L (mg/dL × 0.0555)
- Or equivalently in mg/dL with the conversion handled — HOMA-β = (360 × fasting insulin) / (fasting glucose − 63)
| HOMA-β (percent) | Interpretation |
|---|---|
| Greater than 100 | Normal or hyperfunctional beta cells |
| 50 to 100 | Borderline or reduced function |
| 20 to 50 | Substantial beta-cell decline (often type 2 progression) |
| Less than 20 | Severe beta-cell failure (advanced T2D or T1D) |
When HOMA-IR Is Useful
| Clinical use | Why HOMA-IR helps |
|---|---|
| Early insulin resistance detection | Identifies metabolic dysfunction before glucose rises |
| PCOS evaluation | Quantifies the insulin resistance core feature |
| NAFLD/MASLD risk stratification | Strongly correlates with hepatic steatosis |
| Metabolic syndrome assessment | Adds physiological insight beyond waist circumference |
| Pediatric obesity workup | Detects insulin resistance in children |
| Tracking response to weight loss / metformin / GLP-1 | Sensitive to improvements over time |
| Research studies | Most widely used insulin resistance index in literature |
How to Get the Data You Need
- Order fasting insulin and fasting glucose from the same morning blood draw.
- Fast at least 8 hours, ideally 10 to 12, with water only.
- Do not exercise heavily the day before — it can transiently lower fasting insulin.
- Avoid the day after a high-carb meal or alcohol binge — same reason.
- Repeat the test on a separate morning if the result is borderline.
- Use the US formula if your results are in mg/dL and microIU/mL; SI if mmol/L and mIU/L.
Limitations of HOMA-IR
- Assay variability: insulin assays differ across labs. Comparing HOMA-IR values from different platforms is not reliable.
- Pulsatile insulin secretion: single-draw noise is significant. Repeat or average two to three draws for important decisions.
- Beta-cell failure confound: in advanced type 2 diabetes, fasting insulin can fall as beta cells fail — HOMA-IR may underestimate true tissue resistance.
- Not valid on injected insulin: exogenous insulin makes the formula meaningless.
- Insulin antibodies: previous insulin exposure can interfere with the assay.
- Non-linear at extremes: the index is most accurate in the mid-range; values above 8 to 10 are imprecise.
- Estimate, not measurement: the gold standard is the hyperinsulinemic-euglycemic clamp; HOMA-IR correlates with clamp-derived insulin sensitivity but is not perfect.
Comparison with Other Insulin Sensitivity Indices
| Index | Inputs | Advantage | Limitation |
|---|---|---|---|
| HOMA-IR | Fasting insulin, fasting glucose | Simple, widely used, validated | Pulsatile noise |
| QUICKI | Same as HOMA | More linear at low values | Same limitations |
| Matsuda index | OGTT insulin and glucose curves | Reflects dynamic sensitivity | OGTT required |
| HOMA-β | Same as HOMA-IR | Estimates beta-cell function | Same limitations |
| Disposition index | Insulin secretion × sensitivity | Captures the secretion/sensitivity trade-off | Complex; OGTT or IVGTT |
| Clamp (gold standard) | IV insulin and glucose infusion | Direct measurement | Research only |
What to Do With a High HOMA-IR Result
- Confirm with a repeat fasting test on a different morning to rule out pulsatile or post-meal noise.
- Evaluate driver factors — visceral fat, sedentary lifestyle, low fiber/high refined carb diet, poor sleep, chronic stress, fatty liver.
- Implement evidence-based interventions — 5 to 10 percent weight loss, structured exercise (resistance plus aerobic), Mediterranean or low-carb dietary pattern, sleep optimization.
- Reassess HOMA-IR after 3 to 6 months of consistent lifestyle change.
- If HOMA-IR remains high despite lifestyle changes, talk to your doctor about pharmacologic options like metformin or GLP-1 receptor agonists.
Related Reading
See our broader guides on detection of prediabetes, fasting insulin testing, c-peptide testing, is prediabetes reversible, and prediabetes treatment.
The Bottom Line
The HOMA-IR calculator turns two simple fasting labs — insulin and glucose — into a single insulin resistance index. The math is straightforward: in US units, multiply fasting insulin (microIU/mL) by fasting glucose (mg/dL) and divide by 405. Under 1.0 is optimal, 1.0 to 2.0 is normal, 2.5 starts significant insulin resistance, and above 5.0 is severe. HOMA-IR is most useful for detecting early metabolic dysfunction before glucose rises, evaluating PCOS and fatty liver, and tracking response to lifestyle changes. It shares all the limitations of fasting insulin — assay variability, pulsatile noise, beta-cell failure confounding — and is not a substitute for diabetes diagnostic testing. Use it as one piece of a broader metabolic workup, and talk to your doctor about what your specific result means for your health.