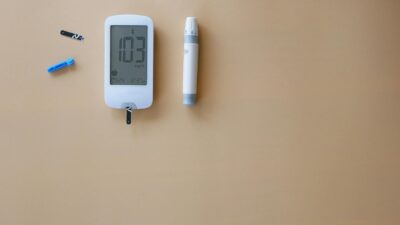
A complete glucose level chart shows normal, prediabetes, and diabetes cutoffs across the four main testing modalities: fasting plasma glucose, 2-hour post-meal (or OGTT) glucose, random glucose, and A1C. Each test measures a different aspect of glucose regulation, and a comprehensive picture often requires more than one result.
Master Glucose Level Chart
| Test | Normal | Prediabetes | Diabetes |
|---|---|---|---|
| Fasting plasma glucose | Under 100 mg/dL (5.6 mmol/L) | 100-125 mg/dL (5.6-6.9 mmol/L) | 126 mg/dL or higher (7.0+ mmol/L) |
| 2-hour OGTT or post-meal | Under 140 mg/dL (7.8 mmol/L) | 140-199 mg/dL (7.8-11.0 mmol/L) | 200 mg/dL or higher (11.1+ mmol/L) |
| A1C | Under 5.7% | 5.7-6.4% | 6.5% or higher |
| Random glucose (with symptoms) | Under 140 mg/dL | N/A | 200 mg/dL or higher |
All thresholds are from the ADA Standards of Care 2024. A diagnosis of diabetes requires two separate tests meeting criteria, either the same test repeated on a different day or two different tests at the same draw.
Fasting Glucose Detail
Fasting plasma glucose is measured after no food or drink except water for at least 8 hours. It reflects overnight hepatic glucose production and basal insulin resistance.
| Fasting mg/dL | Fasting mmol/L | Meaning |
|---|---|---|
| 70-99 | 3.9-5.5 | Normal |
| 100-109 | 5.6-6.0 | Prediabetes (lower) |
| 110-125 | 6.1-6.9 | Prediabetes (upper) |
| 126-150 | 7.0-8.3 | Diabetes (mild) |
| 151-250 | 8.4-13.9 | Diabetes (moderate to high) |
| Over 250 | Over 13.9 | Diabetes (uncontrolled) |
Post-Meal Glucose Detail
2-hour glucose can be measured two ways: after a standardized 75-gram oral glucose tolerance test, or 2 hours after a regular meal. The OGTT is more reproducible and is the gold standard for gestational diabetes screening.
| 2-Hour mg/dL | 2-Hour mmol/L | Meaning |
|---|---|---|
| Under 140 | Under 7.8 | Normal |
| 140-169 | 7.8-9.4 | Prediabetes (IGT, lower) |
| 170-199 | 9.4-11.0 | Prediabetes (IGT, upper) |
| 200-249 | 11.1-13.8 | Diabetes (mild) |
| Over 250 | Over 13.9 | Diabetes (uncontrolled) |
A1C Chart Detail
A1C reflects the average percentage of hemoglobin bound to glucose over the past 2-3 months. It is the easiest screening test because it does not require fasting and is stable across the day.
| A1C | eAG mg/dL | eAG mmol/L | Category |
|---|---|---|---|
| 5.0% | 97 | 5.4 | Normal |
| 5.6% | 114 | 6.3 | Normal (upper) |
| 5.7% | 117 | 6.5 | Prediabetes (lower) |
| 6.4% | 137 | 7.6 | Prediabetes (upper) |
| 6.5% | 140 | 7.8 | Diabetes |
| 7.0% | 154 | 8.6 | Diabetes (typical target) |
| 9.0% | 212 | 11.8 | Poorly controlled |
See our A1C levels hub for the full chart and interpretation guide.
Why Different Tests Disagree
It is common for one glucose test to fall into prediabetes while another looks normal. The tests measure different things:
- Fasting glucose measures the overnight state. Sensitive to hepatic insulin resistance and sleep quality.
- 2-hour glucose measures meal response. Sensitive to beta-cell function and muscle insulin sensitivity.
- A1C measures 3-month average across all states. Sensitive to both fasting and post-meal glucose over time.
Isolated impaired fasting glucose, isolated impaired glucose tolerance, and elevated A1C alone are all valid prediabetes patterns. Having two abnormal tests together carries higher progression risk than one alone.
Target Ranges for People With Diabetes
Once diabetes is diagnosed, the ADA recommends treatment targets rather than diagnostic cutoffs:
| Time | Typical Target |
|---|---|
| Fasting or pre-meal | 80-130 mg/dL |
| 2 hours post-meal | Under 180 mg/dL |
| A1C | Under 7% (most adults) |
| Time in range (CGM) | Over 70% in 70-180 mg/dL |
| Time below range (CGM) | Under 4% below 70 mg/dL |
Converting Between Units
United States labs report glucose in mg/dL. Most of the rest of the world uses mmol/L. Conversion is simple:
- mg/dL to mmol/L: divide by 18.018
- mmol/L to mg/dL: multiply by 18.018
Examples: 100 mg/dL = 5.6 mmol/L, 126 mg/dL = 7.0 mmol/L, 200 mg/dL = 11.1 mmol/L.
How Often to Test
- Adults without diabetes, no risk factors: screen at age 35, repeat every 3 years if normal.
- Overweight or obese with risk factors: screen earlier and more often.
- Prediabetes: annual A1C at minimum.
- Type 2 diabetes on oral meds: A1C every 3-6 months; home glucose as directed.
- Insulin users: multiple daily home tests or continuous glucose monitoring.
For treatment-specific monitoring, see our treatment hub.
The Bottom Line
A complete glucose level chart covers fasting (under 100 normal, 100-125 prediabetes, 126+ diabetes), 2-hour post-meal (under 140, 140-199, 200+), and A1C (under 5.7, 5.7-6.4, 6.5+). Each test captures a different dimension of glucose regulation, and discrepancies between tests are common and clinically meaningful. Use the chart to interpret your results, confirm elevated values with a second test, and track progress over time.