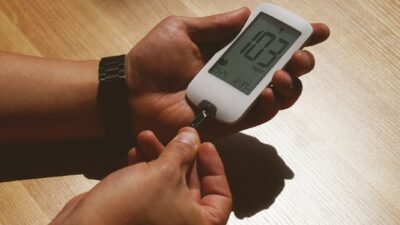
A1C ranges fall into three clinical categories: normal is below 5.7%, prediabetes is 5.7% to 6.4%, and diabetes is 6.5% or higher. These cutoffs, set by the American Diabetes Association, use a single blood test to estimate your average glucose over the past two to three months.
What the A1C Test Actually Measures
The A1C test, also called hemoglobin A1C or HbA1c, measures the percentage of your red blood cells that have glucose attached to them. Because red blood cells live about 120 days, the result reflects your average blood sugar over that span rather than a single moment. That makes it more stable than a fasting glucose check and useful for long-term tracking.
According to the Centers for Disease Control and Prevention, the test does not require fasting and can be drawn at any time of day. Most results come back within a few days from a standard lab.
The Standard A1C Ranges at a Glance
These ranges come from the ADA Standards of Care and are used by clinicians across the United States.
| A1C Result | Category | Estimated Average Glucose |
|---|---|---|
| Below 5.7% | Normal | Below 117 mg/dL |
| 5.7% – 6.4% | Prediabetes | 117-137 mg/dL |
| 6.5% or higher | Diabetes | 140 mg/dL or higher |
A single A1C at or above the cutoff is usually repeated on a separate day before a formal diagnosis, especially when the first value sits near the boundary.
Normal A1C: Below 5.7%
An A1C below 5.7% means your average glucose over recent months has been in the non-diabetic range. Most healthy adults fall somewhere between 4.8% and 5.6%. A value in this range does not guarantee you will stay there forever — weight gain, inactivity, and aging can all push numbers upward over time.
If you have a family history of type 2 diabetes or other risk factors, the ADA generally recommends retesting every three years even when your result is normal. You can learn more about what typical numbers look like in our A1C 5.3 guide.
Prediabetes A1C: 5.7% to 6.4%
A result in this range means your blood sugar is higher than normal but not high enough to be diabetes. Roughly one in three U.S. adults has prediabetes, and many do not know it, according to CDC surveillance data. Without changes, a significant share will progress to type 2 diabetes within five years.
The good news: prediabetes is often reversible. Modest weight loss of 5-7% of body weight, combined with at least 150 minutes of weekly moderate exercise, has been shown in the Diabetes Prevention Program to cut progression risk by 58%. Our overview on reversing prediabetes walks through what works.
Where You Fall Inside the Prediabetes Band Matters
An A1C of 5.7% is barely inside prediabetes territory, while 6.3% sits one tick away from diabetes. Higher values within the band generally signal greater urgency. That said, the test has roughly ±0.3% lab variability, so a single borderline number should be interpreted with care.
Diabetes A1C: 6.5% and Above
An A1C of 6.5% or higher on two separate tests confirms diabetes, per ADA guidance. A single very high result — for example 8% or above — accompanied by classic symptoms like excessive thirst, frequent urination, or unintentional weight loss may be enough for diagnosis without a repeat.
Treatment typically combines lifestyle changes with medication. Metformin is the most common first-line drug, but newer options such as GLP-1 receptor agonists are increasingly used when weight loss is a goal. Review our treatment hub for an overview of current approaches.
Why Your A1C Number Might Be Misleading
A1C is not perfect. Several conditions can falsely raise or lower your result, which is why clinicians cross-check with fasting glucose or an oral glucose tolerance test when needed.
- Anemia or recent blood loss: can lower A1C artificially.
- Hemoglobin variants (sickle cell trait, thalassemia): may affect certain assays.
- Kidney disease or chronic liver disease: can shift results in either direction.
- Recent blood transfusion: distorts the 3-month average.
- Pregnancy: A1C is less reliable; alternative tests are usually preferred.
If any of these apply, ask your doctor whether a fructosamine test or continuous glucose monitor data might give a clearer picture.
A1C Targets Versus A1C Ranges
The three ranges above are diagnostic — they label where you currently sit. Targets are different: they are the numbers your doctor wants you to aim for once diagnosed. The ADA suggests an A1C target below 7% for many nonpregnant adults with diabetes, with tighter or looser goals depending on age, health, and hypoglycemia risk.
For people with prediabetes, the practical goal is simple: get back under 5.7%. That usually means improving insulin sensitivity through movement, sleep, and food choices rather than relying on medication.
How Often Should You Test?
Testing frequency depends on your current range and risk factors. The NIDDK outlines typical intervals, though your clinician may adjust based on your situation.
| Status | Typical Retest Interval |
|---|---|
| Normal, no risk factors | Every 3 years |
| Normal, with risk factors | Every 1-2 years |
| Prediabetes | Every 6-12 months |
| Diabetes, stable and at goal | Every 6 months |
| Diabetes, not at goal or changing therapy | Every 3 months |
Lifestyle Steps That Move A1C Within Ranges
Small, consistent habits tend to produce the most durable A1C changes. These are general patterns supported by clinical trials, not prescriptions — your doctor can tailor them to you.
- Walk after meals. A 10-15 minute walk can blunt post-meal glucose spikes.
- Swap refined carbs for fiber-rich options. Whole grains, beans, and vegetables slow glucose absorption.
- Prioritize sleep. Fewer than 6 hours is associated with higher fasting glucose.
- Add resistance training twice a week. Muscle is your largest glucose sink.
- Limit sugary drinks. Liquid sugar is among the fastest drivers of A1C upward.
The Bottom Line
A1C ranges give you a clear framework: under 5.7% is normal, 5.7-6.4% is prediabetes, and 6.5% or higher is diabetes. Where you land matters, but so does the trend — a rising A1C within the normal range may warrant attention before it crosses into prediabetes. Use the number as a starting point for a conversation with your doctor, not as a final verdict, and remember that most A1C values can be improved with consistent, well-chosen habits.