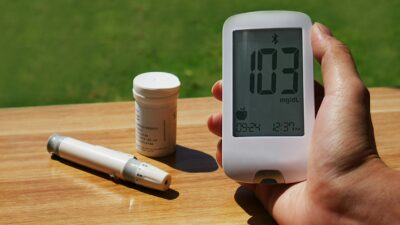
A blood glucose chart is a reference table that lists healthy and concerning ranges for different times of day — fasting, before meals, one to two hours after meals, and bedtime. For most adults without diabetes, fasting glucose stays below 100 mg/dL and two-hour post-meal glucose stays below 140 mg/dL. People with diabetes typically aim for fasting 80 to 130 mg/dL and under 180 mg/dL two hours after eating, per the American Diabetes Association.
The Core Blood Glucose Chart
The table below summarizes the most commonly cited targets from the ADA’s Standards of Care. Individual goals may be higher or lower depending on age, pregnancy, comorbidities, and hypoglycemia risk.
| Timing | Non-Diabetic Normal | Prediabetes | Typical Diabetes Target |
|---|---|---|---|
| Fasting (8+ hours) | 70-99 mg/dL | 100-125 mg/dL | 80-130 mg/dL |
| Before a meal | 70-99 mg/dL | 100-125 mg/dL | 80-130 mg/dL |
| 1 hour after a meal | Below 140 mg/dL | 140-180 mg/dL | Below 180 mg/dL |
| 2 hours after a meal | Below 140 mg/dL | 140-199 mg/dL | Below 180 mg/dL |
| Bedtime | 90-110 mg/dL | Varies | 90-150 mg/dL |
| Random (any time) | Below 140 mg/dL | 140-199 mg/dL | Varies |
Fasting Blood Glucose
Fasting glucose is measured after at least eight hours without food or caloric drinks — typically first thing in the morning. It is one of the three tests used to diagnose prediabetes and diabetes.
- Below 100 mg/dL: Normal
- 100 to 125 mg/dL: Impaired fasting glucose (prediabetes)
- 126 mg/dL or higher on two occasions: Diabetes
If you are curious about the A1C equivalents of these fasting numbers, the A1C levels hub includes a conversion table.
Post-Meal (Postprandial) Blood Glucose
After eating, glucose rises as carbohydrates are digested. In people without diabetes, insulin is released quickly enough to keep the peak below 140 mg/dL and return readings to baseline within about two hours. In prediabetes and diabetes, the peak climbs higher and stays elevated longer.
Two-hour post-meal readings above 200 mg/dL on an oral glucose tolerance test support a diabetes diagnosis. Readings between 140 and 199 mg/dL indicate impaired glucose tolerance, another form of prediabetes that does not always show up on fasting tests.
Bedtime and Overnight Glucose
Bedtime readings help prevent overnight lows, especially for people on insulin or sulfonylureas. A common target for adults with diabetes is 90 to 150 mg/dL at bedtime. Going to sleep below 80 mg/dL, particularly after a workout or alcohol, raises the risk of nocturnal hypoglycemia.
How to Read Your Own Chart
No single reading tells the full story. When reviewing your numbers, look for patterns:
- Are fasting values trending up, down, or stable over two weeks?
- How much does your glucose rise from pre-meal to two-hour post-meal?
- Do certain meals, stress, or poor sleep consistently produce higher spikes?
- Are you seeing any overnight lows below 70 mg/dL?
The CDC recommends logging results alongside food, activity, and medication notes so your care team can make targeted adjustments.
Special Situations
Pregnancy
Targets are tighter during pregnancy. Typical ranges are fasting below 95 mg/dL, one-hour post-meal below 140 mg/dL, and two-hour post-meal below 120 mg/dL. Gestational diabetes care is individualized by an obstetric team.
Older Adults
For older adults or those with multiple chronic conditions, looser targets (for example fasting 90 to 150 mg/dL) may be safer because of hypoglycemia risk.
Children with Type 1 Diabetes
Pediatric targets differ and are set by a pediatric endocrinologist. They balance growth, hypoglycemia unawareness risk, and A1C goals.
Units: mg/dL vs. mmol/L
US labs and home meters usually use mg/dL, while many other countries use mmol/L. Conversion is straightforward: divide mg/dL by 18 to get mmol/L. For example, 100 mg/dL ÷ 18 ≈ 5.6 mmol/L.
| mg/dL | mmol/L |
|---|---|
| 70 | 3.9 |
| 100 | 5.6 |
| 126 | 7.0 |
| 140 | 7.8 |
| 180 | 10.0 |
| 200 | 11.1 |
Factors That Temporarily Shift Glucose
Even in people with stable diabetes, readings fluctuate based on:
- Carbohydrate content of the last meal
- Time since the last injection or oral medication dose
- Physical activity within the previous few hours
- Acute illness, infection, or inflammation
- Stress, poor sleep, or missed meals
- Certain drugs (corticosteroids, some antipsychotics)
- Dehydration or hot weather
Reviewing guidelines from the NIDDK can help you decide when a reading needs immediate action versus a watchful recheck.
When to Contact Your Care Team
Call your clinician promptly if you see:
- Repeated fasting readings above 180 mg/dL
- Post-meal readings above 250 mg/dL on several days
- Any reading below 54 mg/dL, especially with confusion or seizure risk
- Readings above 300 mg/dL with thirst, frequent urination, or fruity breath (possible ketoacidosis)
Connecting the Chart to Your Daily Plan
Numbers only matter if they drive action. After reviewing your chart each week, pick one pattern to address — perhaps the post-dinner spike or the low-activity morning creep. Small changes to meal composition, activity timing, or medication schedules often add up. The diet and nutrition section offers practical adjustments for common spike triggers.
The Bottom Line
A blood glucose chart is a map, not a report card. It helps you compare today’s numbers to evidence-based ranges, spot patterns that need attention, and communicate clearly with your clinician. Treat it as a rolling conversation with your body — and use the patterns you see to guide specific, realistic tweaks rather than perfection.