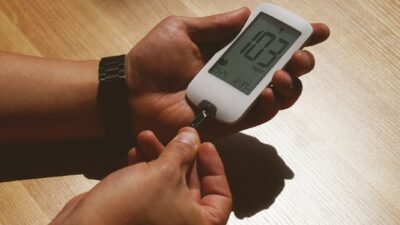
An A1C to glucose chart lets you translate your A1C percentage into an estimated average glucose (eAG) in mg/dL or mmol/L using the American Diabetes Association’s validated formula. The quick version: an A1C of 6.0% equals roughly 126 mg/dL, 7.0% equals about 154 mg/dL, and 8.0% equals around 183 mg/dL. Use the chart below, then confirm interpretation with your clinician.
The A1C to Glucose Formula
The ADA uses an equation derived from the 2008 A1C-Derived Average Glucose (ADAG) study: eAG (mg/dL) = 28.7 × A1C − 46.7. To convert mg/dL to mmol/L, divide by 18. This formula was built by pairing A1C values with continuous glucose monitoring and frequent fingersticks across 507 adults from multiple countries, so it represents a population average rather than a personal calibration.
Full A1C to Glucose Conversion Chart
| A1C (%) | eAG (mg/dL) | eAG (mmol/L) | Category |
|---|---|---|---|
| 5.0 | 97 | 5.4 | Normal |
| 5.5 | 111 | 6.2 | Normal |
| 5.7 | 117 | 6.5 | Prediabetes (lower) |
| 6.0 | 126 | 7.0 | Prediabetes |
| 6.4 | 137 | 7.6 | Prediabetes (upper) |
| 6.5 | 140 | 7.8 | Diabetes threshold |
| 7.0 | 154 | 8.6 | Common adult goal |
| 7.5 | 169 | 9.4 | Above common goal |
| 8.0 | 183 | 10.2 | Elevated |
| 9.0 | 212 | 11.8 | High |
| 10.0 | 240 | 13.3 | Very high |
| 11.0 | 269 | 14.9 | Very high |
| 12.0 | 298 | 16.5 | Critical range |
| 14.0 | 355 | 19.7 | Critical range |
How to Read the Chart
Your eAG is a single number that represents the average of your glucose values across roughly the last 2 to 3 months. Red blood cells live about 120 days, and glucose sticks to hemoglobin on their surface in proportion to its concentration. The more glucose in your blood, the more glycated hemoglobin builds up.
That is why the eAG does not match any one meter reading. A person with an A1C of 7.0% (eAG 154 mg/dL) may have fingerstick values ranging from 90 mg/dL fasting to 220 mg/dL after a big meal. The average still lands at 154.
Normal, Prediabetes, and Diabetes Cutoffs
The ADA classification is simple at the top of the chart but has more nuance in real life:
- Normal: A1C below 5.7% (eAG under 117 mg/dL)
- Prediabetes: A1C 5.7% to 6.4% (eAG 117 to 137 mg/dL)
- Diabetes: A1C 6.5% or higher, confirmed on a second test
For a deeper dive, our A1C levels hub explains each band, and our guide on reversing prediabetes walks through what tends to change these numbers.
Why A1C and Fingerstick Sometimes Disagree
Both measurements are accurate, but they answer different questions. A1C is a long-term average that does not change quickly. A fingerstick or CGM reading shows the moment in time. If your A1C looks lower than your logbook suggests, you may be capturing mostly post-meal peaks. If it looks higher, you may be missing overnight rises. A continuous glucose monitor is the most complete picture.
A few medical conditions also shift A1C independent of glucose:
- Iron-deficiency anemia can falsely raise A1C
- Hemolytic anemia or recent blood loss can falsely lower it
- Pregnancy usually lowers A1C slightly due to red-cell turnover
- Chronic kidney disease and certain hemoglobin variants distort results
The CDC’s A1C overview outlines when clinicians may order fructosamine or other alternative tests.
Using the Chart to Set Goals
Most adults with diabetes aim for an A1C under 7.0%, which corresponds to an eAG of roughly 154 mg/dL. Pregnant women, young adults, and those with few complications may target tighter ranges, while older adults, people with frequent hypoglycemia, or those with advanced comorbidities may set looser targets closer to 8.0%. Goals should always be individualized, not copied from a chart.
mg/dL vs. mmol/L
The United States uses mg/dL; the UK, Canada, and most of Europe use mmol/L. The conversion is straightforward: divide mg/dL by 18 to get mmol/L, or multiply mmol/L by 18 to get mg/dL. An eAG of 154 mg/dL is the same as 8.6 mmol/L.
Common Questions About Accuracy
Lab A1C tests are highly standardized, with typical variability of about 3% to 4%. Home A1C kits are reasonably accurate but may differ from the lab by a few tenths of a percent. Meters vary more: FDA-cleared devices are allowed up to 15% variation from lab reference. A single reading should not prompt a major treatment change on its own.
The Bottom Line
An A1C to glucose chart is a practical tool for translating a lab number into daily context. The ADA formula eAG = 28.7 × A1C − 46.7 gives a close estimate, with 7.0% equal to roughly 154 mg/dL. Remember that eAG is an average, not a replacement for meter or CGM readings, and that some medical conditions can distort A1C. Use this chart to understand trends, set goals with your clinician, and decide whether changes to diet, activity, or medication are worth discussing.