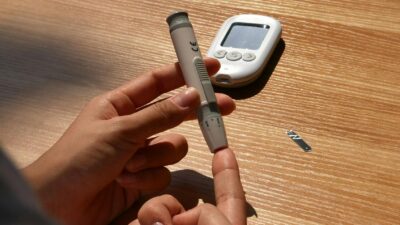
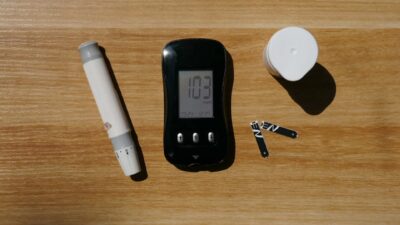
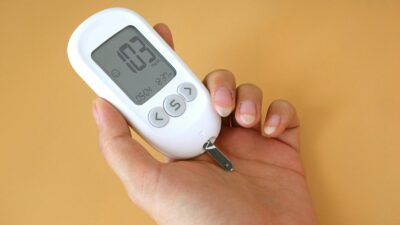
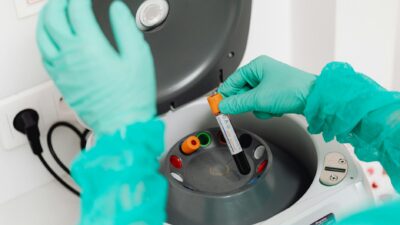
A blood sugar test results chart shows the standard cutoffs set by the American Diabetes Association for fasting glucose, post-meal glucose, A1C, and oral glucose tolerance testing. Understanding which test you had, how it was prepared, and what range your value falls into is the first step in deciding what to do next.
Master Blood Sugar Test Results Chart
| Test | Normal | Prediabetes | Diabetes |
|---|---|---|---|
| Fasting plasma glucose (FPG) | Under 100 mg/dL | 100-125 mg/dL | 126 mg/dL or higher |
| 2-hour OGTT (75 g) | Under 140 mg/dL | 140-199 mg/dL | 200 mg/dL or higher |
| A1C (HbA1c) | Under 5.7% | 5.7% to 6.4% | 6.5% or higher |
| Random plasma glucose | Under 140 mg/dL | N/A | 200+ mg/dL with symptoms |
| 2-hour postprandial (home) | Under 140 mg/dL | 140-199 mg/dL | 200 mg/dL or higher |
| Estimated average glucose (eAG) | Under 114 mg/dL | 117-137 mg/dL | 154 mg/dL or higher |
What Each Test Measures
Fasting plasma glucose captures your overnight glucose level after 8 hours without calories. It reflects hepatic glucose output and basal insulin sensitivity. A1C integrates glucose exposure across the past 2-3 months and reflects chronic dysglycemia. Oral glucose tolerance test measures how your body handles a standardized 75-gram glucose drink, highlighting post-meal insulin response. Random glucose is a snapshot at any time of day and is used mostly in symptomatic screening. For deeper detail, see our A1C levels hub.
How to Prepare for Each Test
Preparation differs by test, which is why ordering the wrong one can lead to confusion.
- FPG and OGTT: 8-12 hours without caloric intake. Water, black coffee, and plain tea are allowed. Continue regular medications unless told otherwise.
- A1C: No fasting, any time of day. Recent meals do not affect the result.
- Random glucose: No preparation. Used mainly when symptoms (polyuria, polydipsia, weight loss) are present.
- 2-hour postprandial: Eat a standard meal, then wait exactly 2 hours from the first bite.
Accuracy of Each Method
Lab-run fasting and random glucose tests are accurate within +/- 2-3 mg/dL using enzymatic methods. A1C on an NGSP-certified analyzer is accurate within +/- 0.3%. Home glucose meters are required by the FDA to read within 15% of reference values 95% of the time and typically perform at +/- 10%. Continuous glucose monitors like Dexcom G7 and Libre 3 have a mean absolute relative difference (MARD) around 8-9%, close to lab accuracy for most trends.
Several factors can distort results. Acute illness, steroids, and dehydration raise glucose. Anemia, recent transfusion, and hemoglobin variants can skew A1C. Dawn phenomenon adds 5-15 mg/dL to morning fasting values. Always repeat an abnormal result on a separate day before accepting a new diagnosis, unless classic symptoms are present.
When to Order Which Test
For routine adult screening, ADA accepts A1C, FPG, or OGTT. A1C is most convenient. FPG catches hepatic insulin resistance. OGTT is the gold standard for pregnancy screening and for people with normal A1C but symptoms of post-meal spikes. Many clinicians order A1C plus FPG on the same draw to reduce missed cases.
What to Do with Abnormal Numbers
If any value lands in the prediabetes band, confirm on a second test within 1-3 months. Then build a plan. The Diabetes Prevention Program showed that 5-7% weight loss, 150 minutes of weekly moderate exercise, and a reduced-calorie diet cut three-year progression to type 2 diabetes by 58%. Review our diet and treatment hubs for specific strategies. Values in the diabetes range require a repeat confirmation and a medical management plan, often including metformin.
The Bottom Line
A blood sugar test results chart turns raw numbers into clinical categories. Normal fasting is under 100 mg/dL, normal A1C is under 5.7%, and normal 2-hour post-meal is under 140 mg/dL. Know which test you had, how it was prepared, and confirm any abnormal value with a repeat draw before assuming a new diagnosis.