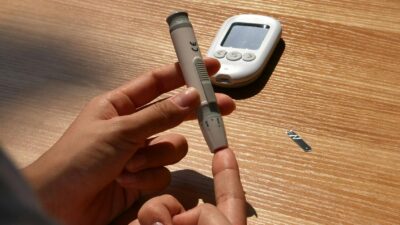
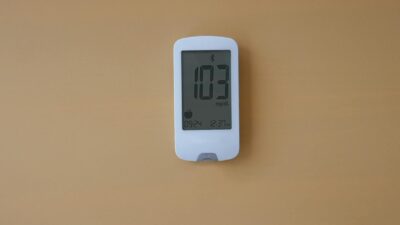
Insulin resistance is diagnosed through a combination of clinical evaluation and laboratory testing. The most commonly used tools are fasting insulin, fasting glucose, and the calculated HOMA-IR index, supplemented by waist circumference, triglyceride-to-HDL ratio, and sometimes an oral glucose tolerance test with insulin levels. No single test defines the diagnosis.
Why Insulin Resistance Is Hard to Diagnose
Early in insulin resistance, the pancreas compensates by producing more insulin, keeping blood glucose normal. Standard diagnostic tests focused on glucose – fasting glucose, A1C – miss this compensated phase. By the time glucose rises into the prediabetes range, insulin resistance has often been present for years. Diagnosing the earlier state requires looking at insulin directly.
Clinical Clues
Before any lab, a clinician evaluates signs and symptoms that suggest insulin resistance:
- Central adiposity: Waist circumference greater than 40 inches in men or 35 inches in women.
- Acanthosis nigricans: Darkened, velvety skin in body folds, especially the neck and armpits.
- Skin tags: Often clustered on the neck and under the arms.
- Polycystic ovary syndrome: Irregular cycles, hirsutism, or ovarian cysts in women.
- Nonalcoholic fatty liver disease: Elevated ALT or fatty liver on imaging.
- High blood pressure, elevated triglycerides, low HDL: The metabolic syndrome cluster.
Core Laboratory Tests
| Test | Purpose | Typical result suggesting resistance |
|---|---|---|
| Fasting plasma glucose | Baseline blood glucose after 8-hour fast | Above 100 mg/dL |
| Fasting insulin | Direct measure of insulin secretion | Above 10-15 microIU/mL |
| HOMA-IR | Ratio combining fasting glucose and insulin | Above 2.5-3.0 |
| A1C | Average glucose over ~3 months | 5.7-6.4% suggests prediabetes |
| Triglyceride/HDL ratio | Indirect marker | Above 3.0 (mg/dL units) |
| ALT | Liver inflammation marker | Persistently above reference range |
Understanding HOMA-IR
The Homeostatic Model Assessment of Insulin Resistance (HOMA-IR) was developed by Matthews and colleagues in 1985. It uses only a single fasting blood draw. The calculation in US units is:
HOMA-IR = (fasting insulin in microIU/mL × fasting glucose in mg/dL) / 405
Most laboratories calculate it automatically when fasting insulin and glucose are both ordered. General interpretation, with caveats for ethnicity and laboratory assay:
- Below 1.0: likely insulin sensitive.
- 1.0-2.5: borderline.
- 2.5-5.0: moderate resistance.
- Above 5.0: significant resistance.
The Oral Glucose Tolerance Test With Insulin
For a more detailed picture, a clinician may order a 2-hour oral glucose tolerance test (OGTT) with insulin levels drawn at 0, 30, 60, 90, and 120 minutes. This allows calculation of the Matsuda index, a whole-body sensitivity score that captures both fasting and post-load response. The Matsuda index correlates well with the gold-standard clamp and is particularly useful when fasting values are borderline.
The Gold Standard: Clamp Studies
The euglycemic-hyperinsulinemic clamp, developed by DeFronzo and colleagues, is the research standard for quantifying insulin resistance. Insulin is infused at a fixed rate while glucose is infused at whatever rate maintains blood sugar at 90 mg/dL. The required glucose infusion rate, normalized to body mass, measures insulin sensitivity. Clamps take 3-4 hours and require intravenous access and real-time glucose monitoring; they are impractical outside research settings.
Imaging and Advanced Tests
- Liver ultrasound or FibroScan: Detects fatty liver, strongly correlated with hepatic insulin resistance.
- DXA scan: Measures visceral adipose tissue.
- MRI-PDFF: Research-grade liver fat quantification.
- Continuous glucose monitoring: Can show post-meal spikes suggestive of resistance, though not diagnostic on its own.
When to Get Tested
Consider asking your clinician about insulin resistance testing if you have:
- A family history of type 2 diabetes.
- Central obesity or recent weight gain.
- PCOS or gestational diabetes history.
- Fatty liver on imaging.
- Hypertension, dyslipidemia, or metabolic syndrome.
- Symptoms suggesting reactive hypoglycemia after meals.
The NIDDK and ADA both recommend early detection in higher-risk populations to enable lifestyle change before glucose rises.
Connecting Diagnosis to Action
Diagnosing insulin resistance is only valuable if it leads to action. Confirmed resistance warrants a structured plan: weight loss if overweight, aerobic and resistance training, sleep improvement, nutrition changes, and in some cases medication. Repeat labs at 3-6 months assess response.
The Bottom Line
Insulin resistance is diagnosed through a combination of clinical signs, fasting insulin and glucose, HOMA-IR, and sometimes OGTT with insulin. A1C alone misses early resistance because the pancreas compensates. If you have risk factors, ask your clinician specifically about fasting insulin and HOMA-IR in addition to standard glucose testing. Catching resistance early gives you the longest window to reverse the trajectory through lifestyle and, when appropriate, pharmacologic support.