eAG, short for estimated average glucose, is your A1C translated into the same mg/dL units you see on a home glucose meter. It is not a separate blood test. The lab runs an A1C and then applies a conversion formula so you can compare your long-term average to day-to-day readings.
Where eAG Comes From
In 2008, the ADAG (A1C-Derived Average Glucose) study published in Diabetes Care measured A1C and full-day glucose profiles in 507 adults across ethnic groups, plus 80 people without diabetes. Researchers derived a linear regression: eAG (mg/dL) = 28.7 x A1C – 46.7. The American Diabetes Association formally adopted eAG reporting that year, and most major US labs now print both numbers on the same report.
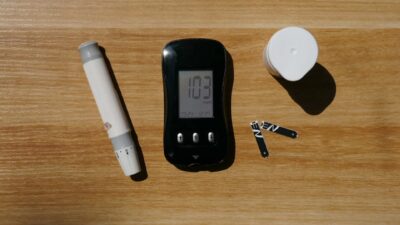
The appeal is practical. A1C percentages are abstract. “Your average glucose over the last three months was 140 mg/dL” is easier to act on than “your A1C is 6.5%.” It also helps people reconcile their meter readings. If your fingerstick average is 130 mg/dL but your eAG is 170 mg/dL, you likely have post-meal or overnight highs that you are not capturing. Learn more at our A1C levels hub.
What to Expect from the Draw
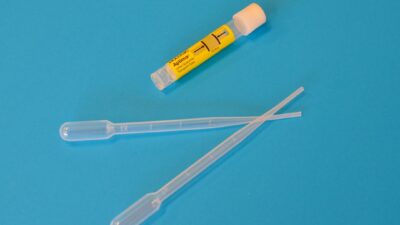
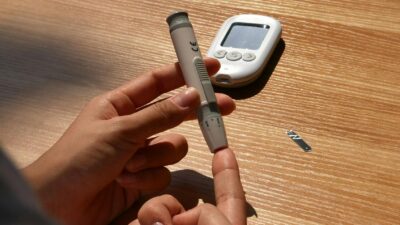
The test itself is an A1C. A phlebotomist draws a small venous sample (usually lavender-top EDTA tube) or, at many primary care offices, performs a capillary fingerstick that feeds a point-of-care analyzer like the DCA Vantage or Afinion. Turnaround time ranges from 6 minutes for point-of-care to 24-48 hours for lab testing. The report lists both A1C (%) and eAG (mg/dL).
How to Prepare
Preparation is simple because there is almost none. You do not need to fast. You do not need to avoid coffee or exercise. You can take your usual medications. Hydration helps the phlebotomist find a vein but does not affect the result. If you have been acutely ill, had a blood transfusion in the past three months, or are in your second or third trimester of pregnancy, mention it, because these can throw off A1C (and therefore eAG) accuracy.
eAG by A1C: Quick Reference
| A1C (%) | eAG (mg/dL) | Category |
|---|---|---|
| 5.0 | 97 | Normal |
| 5.4 | 108 | Normal |
| 5.7 | 117 | Prediabetes (lower) |
| 6.0 | 126 | Prediabetes |
| 6.4 | 137 | Prediabetes (upper) |
| 6.5 | 140 | Diabetes (cutoff) |
| 7.0 | 154 | Diabetes |
Inside the ADAG Study
The 2008 ADAG study is the single trial behind the eAG formula, so understanding its design matters. Researchers enrolled 507 participants at ten international centers: 268 with type 1 diabetes, 159 with type 2 diabetes, and 80 people without diabetes. Each participant wore a continuous glucose monitor for 48 hours during each of four 3-month cycles and performed 7-point fingerstick profiles at least three days per week. The study deliberately included participants of European, African-American, and Hispanic descent to test whether a single formula could work across ethnic groups.
The resulting regression, eAG (mg/dL) = 28.7 x A1C – 46.7, had an R-squared of 0.84, meaning 84% of the variability in average glucose was explained by A1C. That left 16% unexplained, and individuals could deviate by 15% or more from the predicted value. Despite these margins, the ADA, European Association for the Study of Diabetes, and International Diabetes Federation all endorsed eAG reporting as a communication tool, not a diagnostic standard.
Ethnic Variation in Glycation Rates
One limitation that has received growing attention since the ADAG publication is racial and ethnic variation in hemoglobin glycation rates. According to data from NHANES and subsequent analyses, African-American adults tend to have A1C values 0.3-0.4 percentage points higher than non-Hispanic white adults at the same average glucose level. That translates to an eAG that overstates true average glucose by roughly 8-12 mg/dL. South Asian populations show a similar, though smaller, upward shift.
The biological mechanisms are not fully settled. Candidate explanations include differences in red blood cell lifespan, deoxyhemoglobin levels, and genetic variants in the glycation pathway. From a practical standpoint, if you are of African or South Asian descent and your eAG seems higher than your meter or CGM average, the discrepancy may be physiological rather than a sign of hidden hyperglycemia. Discuss it with your clinician before adjusting treatment based on eAG alone.
eAG vs. CGM-Based GMI
Continuous glucose monitors have introduced a competing metric called Glucose Management Indicator (GMI), formerly known as estimated A1C. GMI uses 10 to 14 days of sensor-measured glucose data and its own regression equation to estimate what A1C “should” be. Because GMI draws from real-time sensor readings rather than a single lab measurement, it can detect glucose changes weeks before the next A1C draw.
The key difference is data source. eAG is an A1C-derived estimate of average glucose. GMI is a glucose-derived estimate of A1C. When the two agree, you can be confident in both numbers. When they diverge, the mismatch often points to one of the ethnic glycation differences discussed above, a hemoglobin variant, or a period of rapid glucose change that has not yet fully registered in A1C. For people managing prediabetes reversal with lifestyle changes, GMI can offer earlier feedback, while eAG remains the metric most primary care labs report.
Accuracy and Limits
The ADAG regression is population-based. Most individuals fall within 10-15 mg/dL of their calculated eAG, but outliers exist. Conditions that alter red blood cell turnover, such as iron-deficiency anemia, chronic kidney disease, recent blood loss, or hemoglobinopathies like sickle cell trait, can push A1C (and therefore eAG) in either direction regardless of actual glucose levels. Pregnancy shortens red blood cell lifespan and typically lowers A1C, making eAG appear falsely reassuring in gestational diabetes screening.
If any of these conditions apply to you, your clinician may rely on fructosamine or direct CGM data instead. eAG remains a useful translation layer for the general population, but it is not infallible, and understanding its boundaries helps you interpret the number on your lab report with appropriate context.
What to Do with the Number
If your eAG is above 117 mg/dL (A1C 5.7%), you have crossed into prediabetes territory and should discuss lifestyle strategies with your clinician. Our diet and nutrition guide covers evidence-based food choices. A 5-7% weight loss plus 150 minutes of weekly moderate exercise, the approach tested in the Diabetes Prevention Program, cut progression to diabetes by 58% over three years.
The Bottom Line
When you see eAG on a blood test report, you are reading your A1C expressed as an average blood sugar. A1C 5.7% means eAG 117 mg/dL. Above that line lies prediabetes; above 140 mg/dL eAG (A1C 6.5%) lies diabetes. No fasting is needed, and the result reflects the past 2-3 months, not the past hour.