If your average blood sugar is 140 mg/dL, your estimated A1C is approximately 6.5% — exactly at the diabetes diagnostic threshold. The conversion uses the validated ADAG formula: A1C = (eAG + 46.7) / 28.7. A meter or CGM average sustained at 140 mg/dL over weeks suggests your lab A1C will land in the diabetes range and confirms a need for follow-up testing with your doctor.
The Math: Converting 140 mg/dL to A1C
The relationship between average glucose and A1C comes from the 2008 A1C-Derived Average Glucose (ADAG) study published in Diabetes Care. The validated formula is:
eAG (mg/dL) = (28.7 × A1C) − 46.7
Rearranged to solve for A1C:
A1C (%) = (eAG + 46.7) / 28.7
Plugging in 140 mg/dL:
- A1C = (140 + 46.7) / 28.7
- A1C = 186.7 / 28.7
- A1C = 6.51% (rounded to 6.5%)
What 6.5% Means Clinically
The American Diabetes Association classifies A1C results as follows:
| A1C (%) | Estimated Average Glucose (mg/dL) | Classification |
|---|---|---|
| Below 5.7 | Below 117 | Normal |
| 5.7-6.4 | 117-137 | Prediabetes |
| 6.5 or higher | 140 or higher | Diabetes |
An A1C of 6.5% on two separate occasions — or a single A1C of 6.5% combined with a fasting glucose of 126 mg/dL or higher — meets the ADA criteria for a diabetes diagnosis. Your physician will typically repeat the test to confirm.
Quick Reference: Average Glucose to A1C
| Avg Glucose (mg/dL) | Estimated A1C (%) | Category |
|---|---|---|
| 97 | 5.0 | Normal |
| 117 | 5.7 | Prediabetes (lower bound) |
| 126 | 6.0 | Prediabetes |
| 137 | 6.4 | Prediabetes (upper bound) |
| 140 | 6.5 | Diabetes (threshold) |
| 154 | 7.0 | Diabetes |
| 183 | 8.0 | Diabetes (poor control) |
| 212 | 9.0 | Diabetes (poor control) |
| 240 | 10.0 | Diabetes (very poor control) |
For an interactive version, use our A1C calculator.
Why Estimated A1C Is Not Identical to Lab A1C
The ADAG formula is an average across thousands of patients. Individual A1C can vary 0.5% in either direction at the same average glucose, depending on:
- Red blood cell turnover — faster turnover (e.g., hemolytic anemia) lowers A1C; slower turnover raises it
- Hemoglobin variants — sickle cell trait, HbC, HbE may interfere with A1C assays
- Recent blood loss or transfusion
- Pregnancy — increased red cell turnover lowers A1C
- Iron deficiency — falsely raises A1C
- Chronic kidney disease — variable effects
This is why a CGM-derived average and a lab A1C should both be used together when interpreting glucose control.
Is Your Meter Average Reliable?
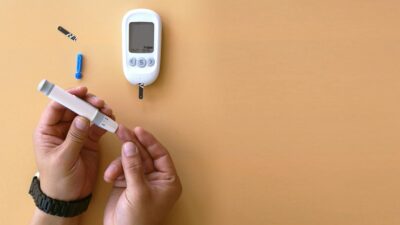
If you only test fasting glucose first thing in the morning, your meter average will systematically underestimate your true 24-hour mean. Postprandial spikes (after meals) are when many people with prediabetes run highest. To get a meaningful average from a fingerstick meter, sample at varied times: fasting, before lunch, 2 hours after dinner, and bedtime, several days a week.
Continuous glucose monitors solve this by sampling every 1-5 minutes. A 14-day CGM average is widely accepted as equivalent to a Glucose Management Indicator (GMI), which is reported alongside time-in-range on most CGM dashboards.
What to Do If Your Average Is 140
- Get a confirmatory lab A1C. Your physician will order a venous lab A1C, which is the diagnostic standard.
- Repeat the A1C in 2-4 weeks if elevated. Two abnormal results confirm the diagnosis.
- Add a fasting glucose or oral glucose tolerance test for a complete picture.
- Begin lifestyle changes immediately — these work whether the diagnosis lands at prediabetes or diabetes.
- Discuss medication options with your doctor if A1C is confirmed at 6.5% or higher.
For more detail on the full A1C-glucose relationship, see our A1C vs glucose chart.
According to the CDC, A1C testing is the most reliable single test for diagnosing type 2 diabetes because it reflects average glucose over the previous 2-3 months — long enough to smooth out day-to-day variation.
The Bottom Line
An average blood sugar of 140 mg/dL converts to an estimated A1C of 6.5%, which sits at the diagnostic threshold for type 2 diabetes. The conversion uses the validated ADAG formula. If your meter or CGM average is consistently around 140, schedule a confirmatory lab A1C with your physician. The earlier you confirm the diagnosis, the sooner you can act — and an A1C in the 6-7% range is highly responsive to diet, exercise, and modest weight loss.