If your average blood sugar is 140 mg/dL, your estimated A1C is about 6.5 percent. That number sits at the threshold the American Diabetes Association uses to diagnose diabetes, so an average running that high deserves a conversation with your clinician and likely a lab-drawn confirmation.
The Conversion Formula
The most widely used conversion comes from the 2008 A1C-Derived Average Glucose (ADAG) study by Nathan and colleagues. The equation is straightforward:
Estimated A1C (%) = (Average Glucose in mg/dL + 46.7) / 28.7
Plugging in 140 mg/dL: (140 + 46.7) / 28.7 = 186.7 / 28.7 ≈ 6.51 percent.
Researchers derived this relationship from roughly 500 participants who wore continuous glucose monitors and performed frequent fingersticks over several months. It is the basis for the estimated Average Glucose (eAG) that most labs now report alongside a lab A1C.
A1C-to-Average-Glucose Reference Table
| A1C (%) | Estimated Average Glucose (mg/dL) | Category |
|---|---|---|
| 5.0 | 97 | Normal |
| 5.5 | 111 | Normal |
| 5.7 | 117 | Prediabetes threshold |
| 6.0 | 126 | Prediabetes |
| 6.4 | 137 | Prediabetes (upper end) |
| 6.5 | 140 | Diabetes threshold |
| 7.0 | 154 | Common adult target ceiling |
| 8.0 | 183 | Elevated |
| 9.0 | 212 | High |
| 10.0 | 240 | Very high |
Source: American Diabetes Association, derived from the ADAG formula.
Why 140 mg/dL Is a Meaningful Number
An average of 140 mg/dL does not mean every reading is 140. It is a weighted average across fasting, pre-meal, post-meal, and overnight values. If your fasting glucose is 110 but your two-hour post-meal readings climb to 170 or 180, you can easily land at a 140 average without realizing it.
Because 6.5 percent is the A1C threshold for diabetes, an average near 140 is often the first signal that prediabetes is progressing. The ADA notes that this boundary was chosen based on the A1C at which retinopathy risk begins to rise sharply, not as an arbitrary cutoff.
How Labs Measure A1C Versus How Meters Average Glucose
A lab A1C measures the percentage of hemoglobin molecules in your red blood cells that have glucose attached. Since red cells live about 120 days, A1C reflects an integrated glucose exposure over roughly 2 to 3 months, weighted more heavily toward the past 30 days.
A meter or CGM average, in contrast, only captures the readings you took or the interstitial fluid the sensor sampled. If you fingerstick mostly before meals, your average will underestimate your 24-hour exposure. If you wear a CGM 24/7, the average is more representative but is not identical to lab A1C.
Why Your Estimated A1C Might Not Match a Lab A1C
Several factors can pull the lab A1C away from the number predicted by your average glucose:
- Red blood cell lifespan: Conditions that shorten red cell life (hemolytic anemia, recent blood loss, erythropoietin therapy) tend to lower A1C relative to average glucose.
- Iron-deficiency anemia: Can raise A1C by extending red cell lifespan.
- Hemoglobin variants: Sickle cell trait, HbC, HbE, and others can interfere with some A1C assay methods. Ask your lab to use an HPLC method if a variant is known.
- Pregnancy: Red cell turnover changes; A1C alone is not used to monitor gestational diabetes.
- CGM sampling gaps: Missing sensor data during certain times (like overnight) can bias the average.
What a 6.5 Percent Result Usually Prompts
If a lab A1C comes back at 6.5 percent, your clinician will likely:
- Repeat the test on a different day to confirm, unless you have clear symptoms and a very high random glucose.
- Order a fasting glucose or oral glucose tolerance test as a second measure.
- Discuss lifestyle changes including dietary pattern, physical activity, and weight management if relevant.
- Consider metformin or another medication, especially if A1C is rising or you have additional risk factors.
- Screen for complications such as kidney function, cholesterol, blood pressure, and dilated eye exam.
For context on where this fits in the spectrum, our prediabetes overview walks through how A1C moves between normal, prediabetes, and diabetes ranges.
How to Lower an Average of 140
Dropping your average from 140 to 120 mg/dL would move your estimated A1C from roughly 6.5 to 5.8 percent. Strategies that tend to move the needle include:
- Reducing refined carbohydrates: Cutting sugary drinks, white bread, and sweets often lowers post-meal peaks quickly.
- Adding fiber and protein to meals: Both slow glucose absorption and blunt spikes.
- Post-meal walking: Even 10 to 15 minutes can reduce the post-meal rise.
- Weight loss when appropriate: Losing 5 to 10 percent of body weight can lower A1C by 0.5 to 1 percentage point for many people.
- Medication adjustment: If you are already on medication, your doctor may adjust the dose or add another agent.
According to the National Institute of Diabetes and Digestive and Kidney Diseases, most adults with diabetes aim for an A1C under 7 percent, though targets are individualized.
Self-Monitoring Tips for Better Average Accuracy
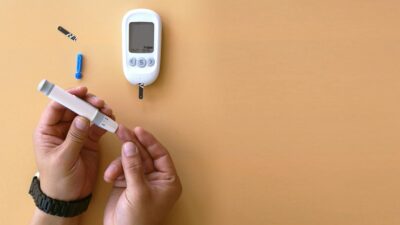
If you rely on fingersticks, a structured testing schedule gives a more faithful average than random checks. Try this rotating pattern:
- Day 1: fasting and two hours after breakfast.
- Day 2: before and two hours after lunch.
- Day 3: before and two hours after dinner.
- Day 4: bedtime and 3 a.m. (once in a while).
This captures each part of the day over a week without requiring 7 to 10 sticks per day.
When to Call Your Doctor
Reach out promptly if you see fingerstick or CGM readings repeatedly above 180 mg/dL, if you experience symptoms like increased thirst, frequent urination, unexplained weight loss, or blurred vision, or if your meter average jumps from one month to the next. A lab-drawn A1C remains the standard for diagnosis and treatment decisions.
The Bottom Line
An average blood sugar of 140 mg/dL estimates out to an A1C of about 6.5 percent, which is the A1C threshold the ADA uses to diagnose diabetes. Meter and CGM averages can differ from lab A1C for several biological reasons, so confirm with a lab test and discuss results with your clinician. If that number is new or trending upward, targeted dietary changes, activity after meals, and a conversation about medication can often bring it down.