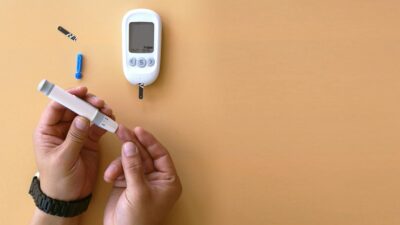
A diabetes chart lays out the blood sugar and A1C ranges used to diagnose and manage diabetes. The three core measurements are A1C (a 3-month average), fasting plasma glucose, and post-meal (postprandial) glucose. This page compiles every reference chart you need in one place, including targets by age and condition.
The Master Diabetes Diagnosis Chart
These are the three tests used to diagnose prediabetes and diabetes, according to the American Diabetes Association.
| Test | Normal | Prediabetes | Diabetes |
|---|---|---|---|
| A1C | Below 5.7% | 5.7% – 6.4% | 6.5% or higher |
| Fasting plasma glucose | Below 100 mg/dL | 100 – 125 mg/dL | 126 mg/dL or higher |
| 2-hour oral glucose tolerance test | Below 140 mg/dL | 140 – 199 mg/dL | 200 mg/dL or higher |
| Random plasma glucose | — | — | 200 mg/dL or higher with symptoms |
Diagnosis typically requires two abnormal tests on separate days, or one abnormal test plus classic symptoms like excessive thirst and urination.
A1C Chart: Converting to Average Glucose
Your A1C represents your average blood sugar over the last 2 to 3 months. Here is what each A1C corresponds to in estimated average glucose (eAG).
| A1C (%) | eAG (mg/dL) | Category |
|---|---|---|
| 5.0 | 97 | Normal |
| 5.5 | 111 | Normal |
| 5.7 | 117 | Prediabetes threshold |
| 6.0 | 126 | Prediabetes |
| 6.4 | 137 | Prediabetes (upper limit) |
| 6.5 | 140 | Diabetes threshold |
| 7.0 | 154 | Diabetes (common ADA target) |
| 8.0 | 183 | Above target |
| 9.0 | 212 | Poorly controlled |
| 10.0 | 240 | Poorly controlled |
| 12.0 | 298 | Severely elevated |
For a deeper dive, see our complete A1C chart and interactive A1C calculator.
Fasting Blood Glucose Chart
Fasting glucose is measured after at least 8 hours without food, typically first thing in the morning.
| Fasting glucose (mg/dL) | Category | What it means |
|---|---|---|
| Below 70 | Hypoglycemia | Low; treat if symptomatic |
| 70 – 99 | Normal | Healthy range |
| 100 – 125 | Impaired fasting glucose | Prediabetes |
| 126 – 180 | Diabetes (mild) | Confirm with a second test |
| 181 – 250 | Diabetes (moderate) | Needs medical management |
| Above 250 | Diabetes (high) | Check ketones if type 1 |
Post-Meal (Postprandial) Glucose Chart
Post-meal glucose is measured 1 to 2 hours after the start of a meal. It reveals how well your body handles carbohydrate loads.
| Time | Normal | Prediabetes | Diabetes |
|---|---|---|---|
| 1 hour after meal | Below 140 mg/dL | 140 – 180 mg/dL | Above 180 mg/dL |
| 2 hours after meal | Below 120 mg/dL | 140 – 199 mg/dL | 200 mg/dL or higher |
| 3 hours after meal | Back to baseline | Slightly elevated | May remain elevated |
Blood Sugar Targets for People With Diabetes
Once diagnosed, the goal shifts to keeping glucose within specific target ranges.
| Time | ADA target (adults) | AACE target (tighter) |
|---|---|---|
| Fasting / before meals | 80 – 130 mg/dL | Below 110 mg/dL |
| 2 hours after meal | Below 180 mg/dL | Below 140 mg/dL |
| Bedtime | 100 – 140 mg/dL | 100 – 140 mg/dL |
| A1C | Below 7.0% | 6.5% or below |
Targets by Age and Population
One size does not fit all. The ADA personalizes targets based on patient characteristics.
| Group | A1C target | Fasting glucose | Rationale |
|---|---|---|---|
| Healthy adults with diabetes | Below 7.0% | 80 – 130 mg/dL | Balance of control and safety |
| Newly diagnosed, low complication risk | Below 6.5% | 70 – 110 mg/dL | Maximize long-term protection |
| Older adults, generally healthy | Below 7.5% | 90 – 130 mg/dL | Slightly looser to reduce hypoglycemia |
| Older adults, complex health | Below 8.0% | 90 – 150 mg/dL | Quality of life priority |
| Older adults, very complex / end of life | Below 8.5% | 100 – 180 mg/dL | Avoid hypoglycemia |
| Pregnancy (gestational or pre-existing) | Below 6.0% | Below 95 mg/dL | Protect fetal development |
| Children with type 1 diabetes | Below 7.0% | 90 – 130 mg/dL | Minimize long-term complications |
Hypoglycemia Chart: Low Blood Sugar Levels
Low blood sugar is as important to recognize as high blood sugar.
| Glucose (mg/dL) | Level | Symptoms | Action |
|---|---|---|---|
| 70 – 80 | Borderline low | None to mild | Monitor; consider a snack |
| 54 – 69 | Level 1 hypoglycemia | Shaky, sweaty, hungry | 15 g fast carbs; recheck in 15 min |
| Below 54 | Level 2 (serious) | Confusion, weakness | Treat immediately; may need help |
| Unconscious / seizure | Level 3 (severe) | Cannot self-treat | Glucagon; call 911 |
Hyperglycemia Chart: High Blood Sugar Levels
| Glucose (mg/dL) | Severity | What to do |
|---|---|---|
| 141 – 180 | Mild elevation | Normal post-meal; monitor pattern |
| 181 – 250 | Moderate | Hydrate, move; check for trends |
| 251 – 350 | High | Check ketones (type 1); call provider if persistent |
| 351 – 500 | Very high | Seek medical advice same day |
| Above 500 | Dangerous | Emergency care |
Continuous Glucose Monitor (CGM) Time-in-Range Chart
If you use a CGM, “time in range” (TIR) is the modern metric.
| Group | Time in range (70-180 mg/dL) | Time below 70 | Time above 180 |
|---|---|---|---|
| Most adults with diabetes | Above 70% | Below 4% | Below 25% |
| Older / high-risk | Above 50% | Below 1% | Below 50% |
| Pregnancy (type 1) | Above 70% (63-140 mg/dL range) | Below 4% | Below 25% |
How to Use These Charts
- Start with A1C for the big-picture average.
- Use fasting glucose to catch early morning patterns.
- Use post-meal checks to refine food choices.
- Personalize targets with your doctor based on age, pregnancy, and other conditions.
- Log numbers over time — patterns matter more than individual readings.
For deeper context on A1C interpretation, visit our A1C levels hub.
The Bottom Line
A complete diabetes chart covers A1C, fasting glucose, post-meal glucose, target ranges by population, and low and high thresholds that require action. Normal A1C is below 5.7%, prediabetes is 5.7-6.4%, and diabetes is 6.5% or higher. Fasting glucose tells a similar story with cutoffs of 100 and 126 mg/dL. Print this page, bookmark our dedicated A1C chart, and bring your numbers to every provider visit.